Live Monitoring
Live monitoring provides a real-time dashboard that updates as you use Claude Code, showing progress bars, burn rates, and cost projections for your active session.
Quick Start
ccusage blocks --liveThis starts live monitoring with automatic token limit detection based on your usage history.
Features
Real-time Updates
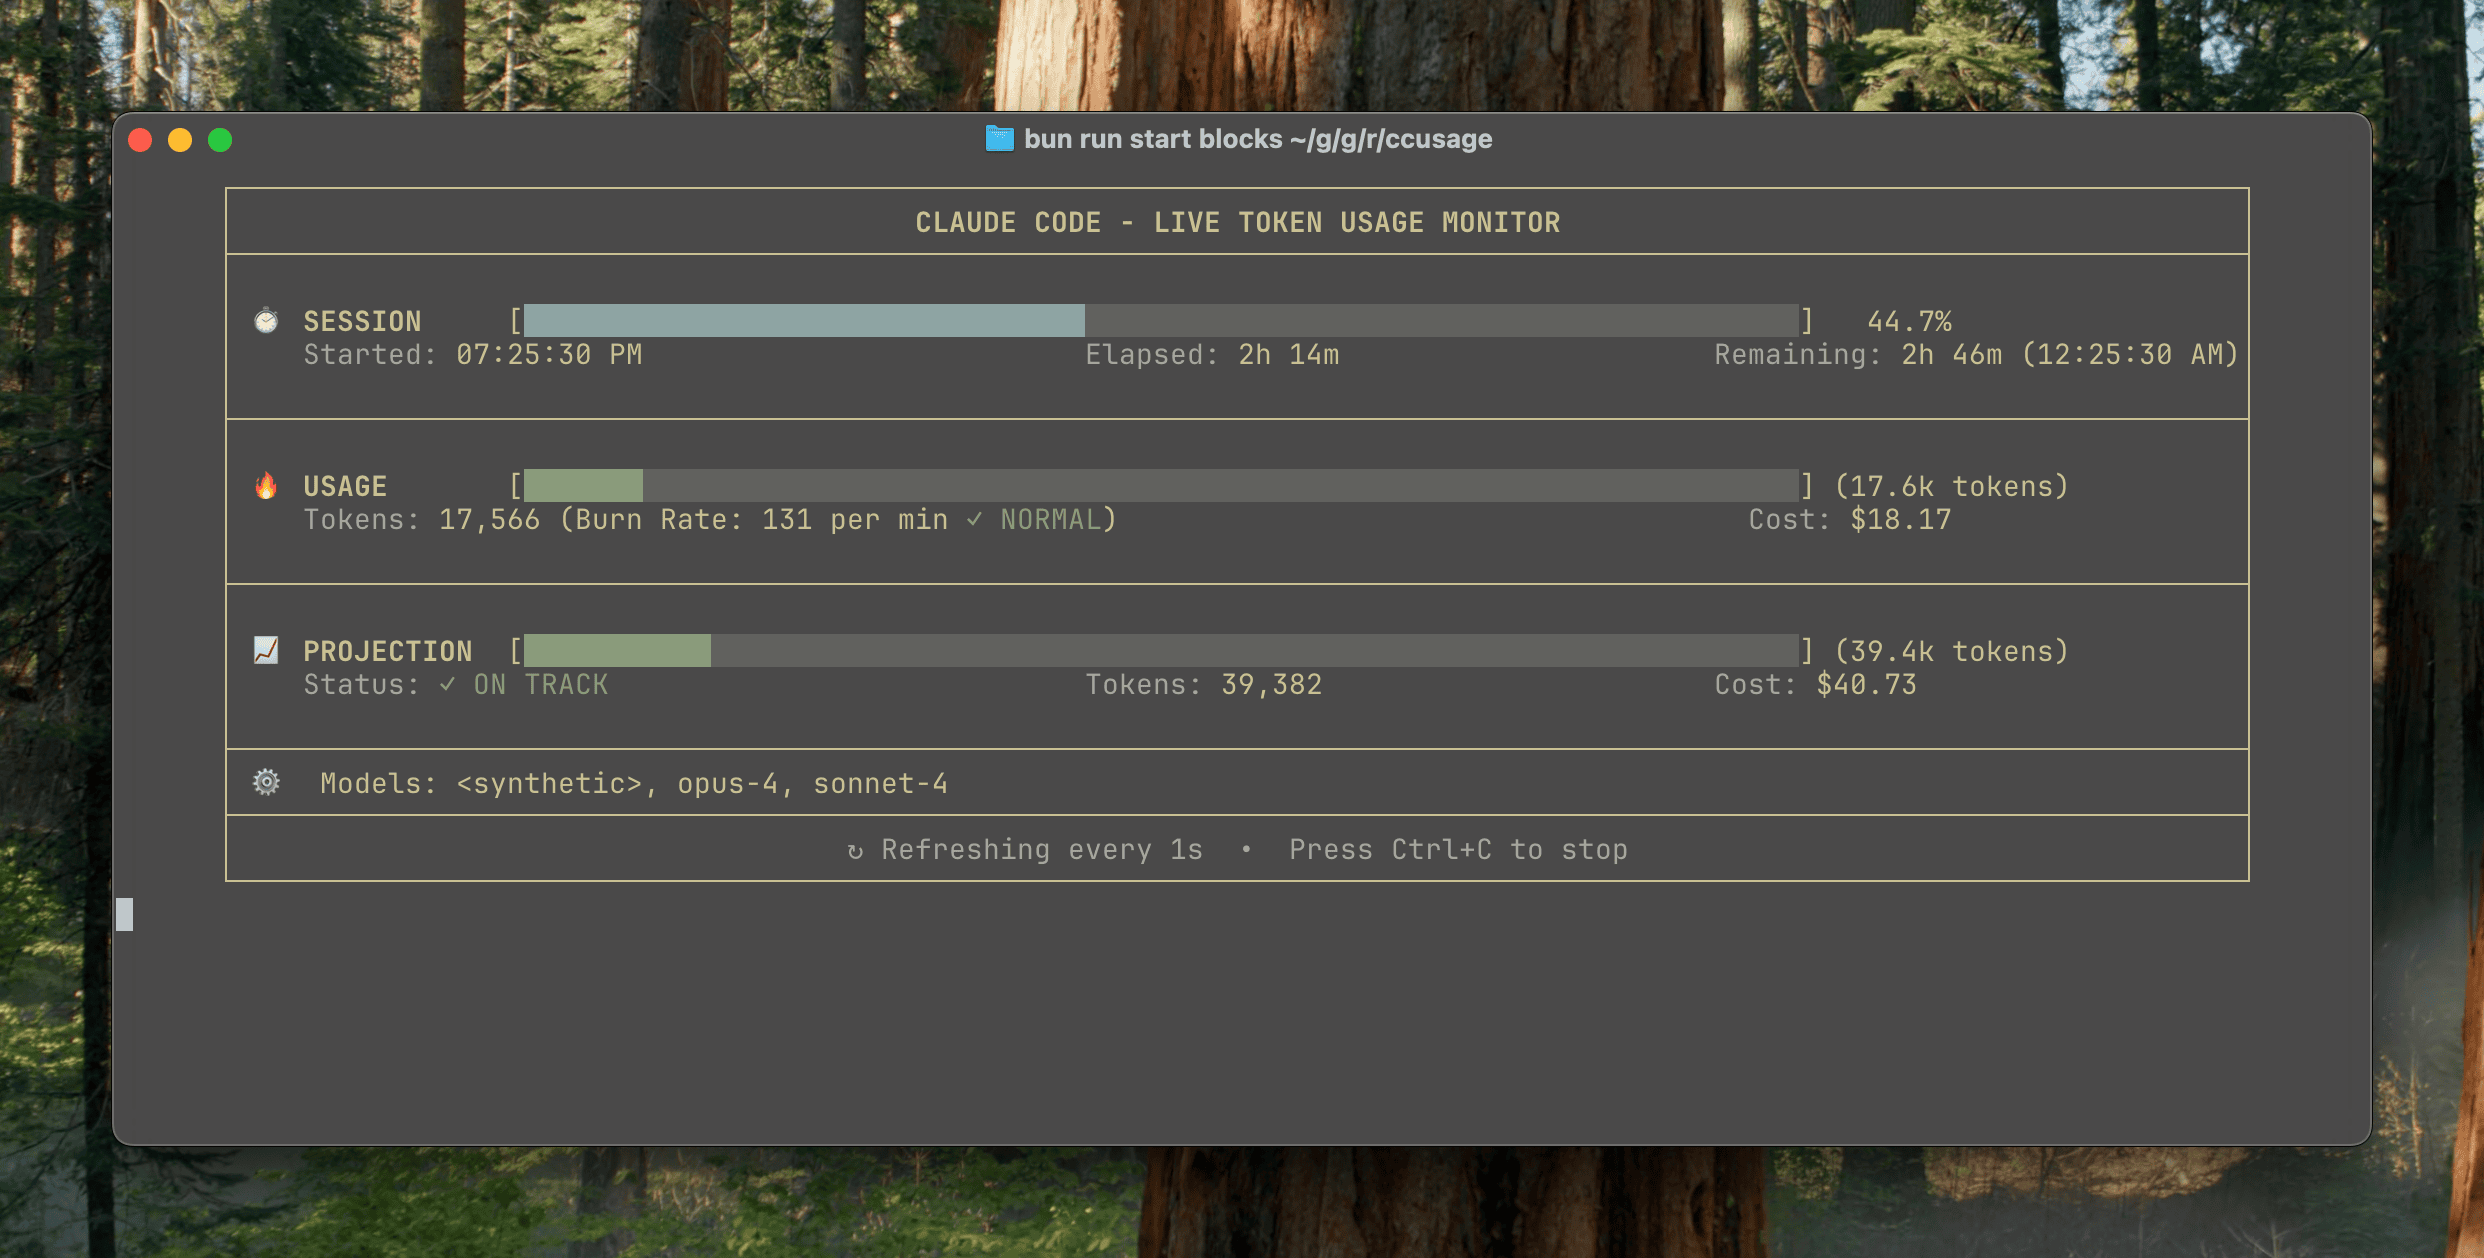
The dashboard refreshes every second, showing:
- Current session progress with visual progress bar
- Token burn rate (tokens per minute)
- Time remaining in current 5-hour block
- Cost projections based on current usage patterns
- Quota warnings with color-coded alerts
Visual Example
Command Options
Token Limits
Set custom token limits for quota warnings:
# Use specific token limit
ccusage blocks --live -t 500000

# Use highest previous session as limit (default)
ccusage blocks --live -t max

# Explicitly set max (same as default)
ccusage blocks --live -t max
Refresh Interval
Control update frequency:
# Update every 5 seconds
ccusage blocks --live --refresh-interval 5

# Update every 10 seconds (lighter on CPU)
ccusage blocks --live --refresh-interval 10

# Fast updates (every 0.5 seconds)
ccusage blocks --live --refresh-interval 0.5
Refresh Rate
- 1 second (default): Good balance of responsiveness and performance
- 0.5-2 seconds: For active monitoring during heavy usage
- 5-10 seconds: For casual monitoring or slower systems
Combined Options
# Custom limit with slower refresh
ccusage blocks --live -t 750000 --refresh-interval 3

# Maximum responsiveness
ccusage blocks --live -t max --refresh-interval 0.5
Understanding the Display
Progress Bar
The progress bar shows token usage within the current 5-hour block:
- Green: Normal usage (0-60% of limit)
- Yellow: Moderate usage (60-80% of limit)
- Red: High usage (80-100% of limit)
Metrics Explained
Current Session
- Tokens used in the current 5-hour block
- Percentage of token limit consumed
Time Remaining
- Hours and minutes left in current block
- Resets every 5 hours from first message
Burn Rate
- Tokens per minute based on recent activity
- Calculated from last 10 minutes of usage
- Used for projections
Cost Tracking
- Current Cost: Actual cost so far in this block
- Projected Cost: Estimated total cost if current rate continues
Warning System
ccusage shows color-coded warnings based on usage:
- 🟢 < 60%: Normal usage
- 🟡 60-80%: Moderate usage warning
- 🔴 80-100%: High usage warning
- ⚠️ > 100%: Over limit warning
Use Cases
Active Development
Monitor usage during intensive coding sessions:
# Monitor with reasonable limit
ccusage blocks --live -t 500000
Perfect for:
- Large refactoring projects
- Documentation generation
- Code review sessions
Team Collaboration
Track usage during pair programming:
# Higher limit for team sessions
ccusage blocks --live -t 1000000
Budget Management
Set strict limits for cost control:
# Conservative monitoring
ccusage blocks --live -t 200000
Learning Sessions
Monitor while learning new technologies:
# Moderate limit with frequent updates
ccusage blocks --live -t 300000 --refresh-interval 2
Tips for Effective Monitoring
1. Set Appropriate Limits
Choose token limits based on your needs:
- Conservative (100k-300k): Light usage, cost-conscious
- Moderate (300k-700k): Regular development work
- High (700k-1M+): Intensive projects, team sessions
2. Monitor Burn Rate
Watch for sudden increases in burn rate:
- Steady rate: Normal conversation flow
- Spikes: Complex queries or large code generation
- High sustained rate: Consider taking breaks
3. Use Projections Wisely
Projections help estimate session costs:
- Early session: Projections may be inaccurate
- Mid-session: More reliable estimates
- Late session: Highly accurate projections
4. Plan Around Blocks
Remember that 5-hour blocks reset:
- Block boundary: Good time for breaks
- New block: Fresh token allowance
- Block overlap: Previous usage doesn't carry over
Keyboard Controls
While live monitoring is active:
- Ctrl+C: Exit monitoring gracefully
- Terminal resize: Automatically adjusts display
Performance Notes
CPU Usage
Live monitoring uses minimal resources:
- 1-second refresh: ~0.1% CPU usage
- 0.5-second refresh: ~0.2% CPU usage
- File watching: Efficient incremental updates
Network Usage
- Offline mode: Zero network usage
- Online mode: Minimal API calls for pricing
- Local analysis: All processing happens locally
Troubleshooting
No Active Session
If no active session is detected:
No active session found. Start using Claude Code to begin monitoring.Solutions:
- Send a message in Claude Code
- Wait a few seconds for data to be written
- Check that Claude Code is running
Incorrect Token Limits
If automatic limit detection fails:
# Manually set a reasonable limit
ccusage blocks --live -t 500000
Performance Issues
If monitoring feels slow:
# Reduce refresh frequency
ccusage blocks --live --refresh-interval 5
Related Commands
- Blocks Reports - Static 5-hour block analysis
- Session Reports - Historical session data
- Daily Reports - Day-by-day usage patterns
Advanced Usage
Combine live monitoring with other tools:
# Monitor in background, export data periodically
ccusage blocks --live &
ccusage session --json > session-backup.json