Daily Reports
Daily reports show token usage and costs aggregated by calendar date, giving you a clear view of your Claude Code usage patterns over time.
Basic Usage
Show all daily usage:
bash
ccusage daily
# or simply:
ccusage
The daily command is the default, so you can omit it when running ccusage.
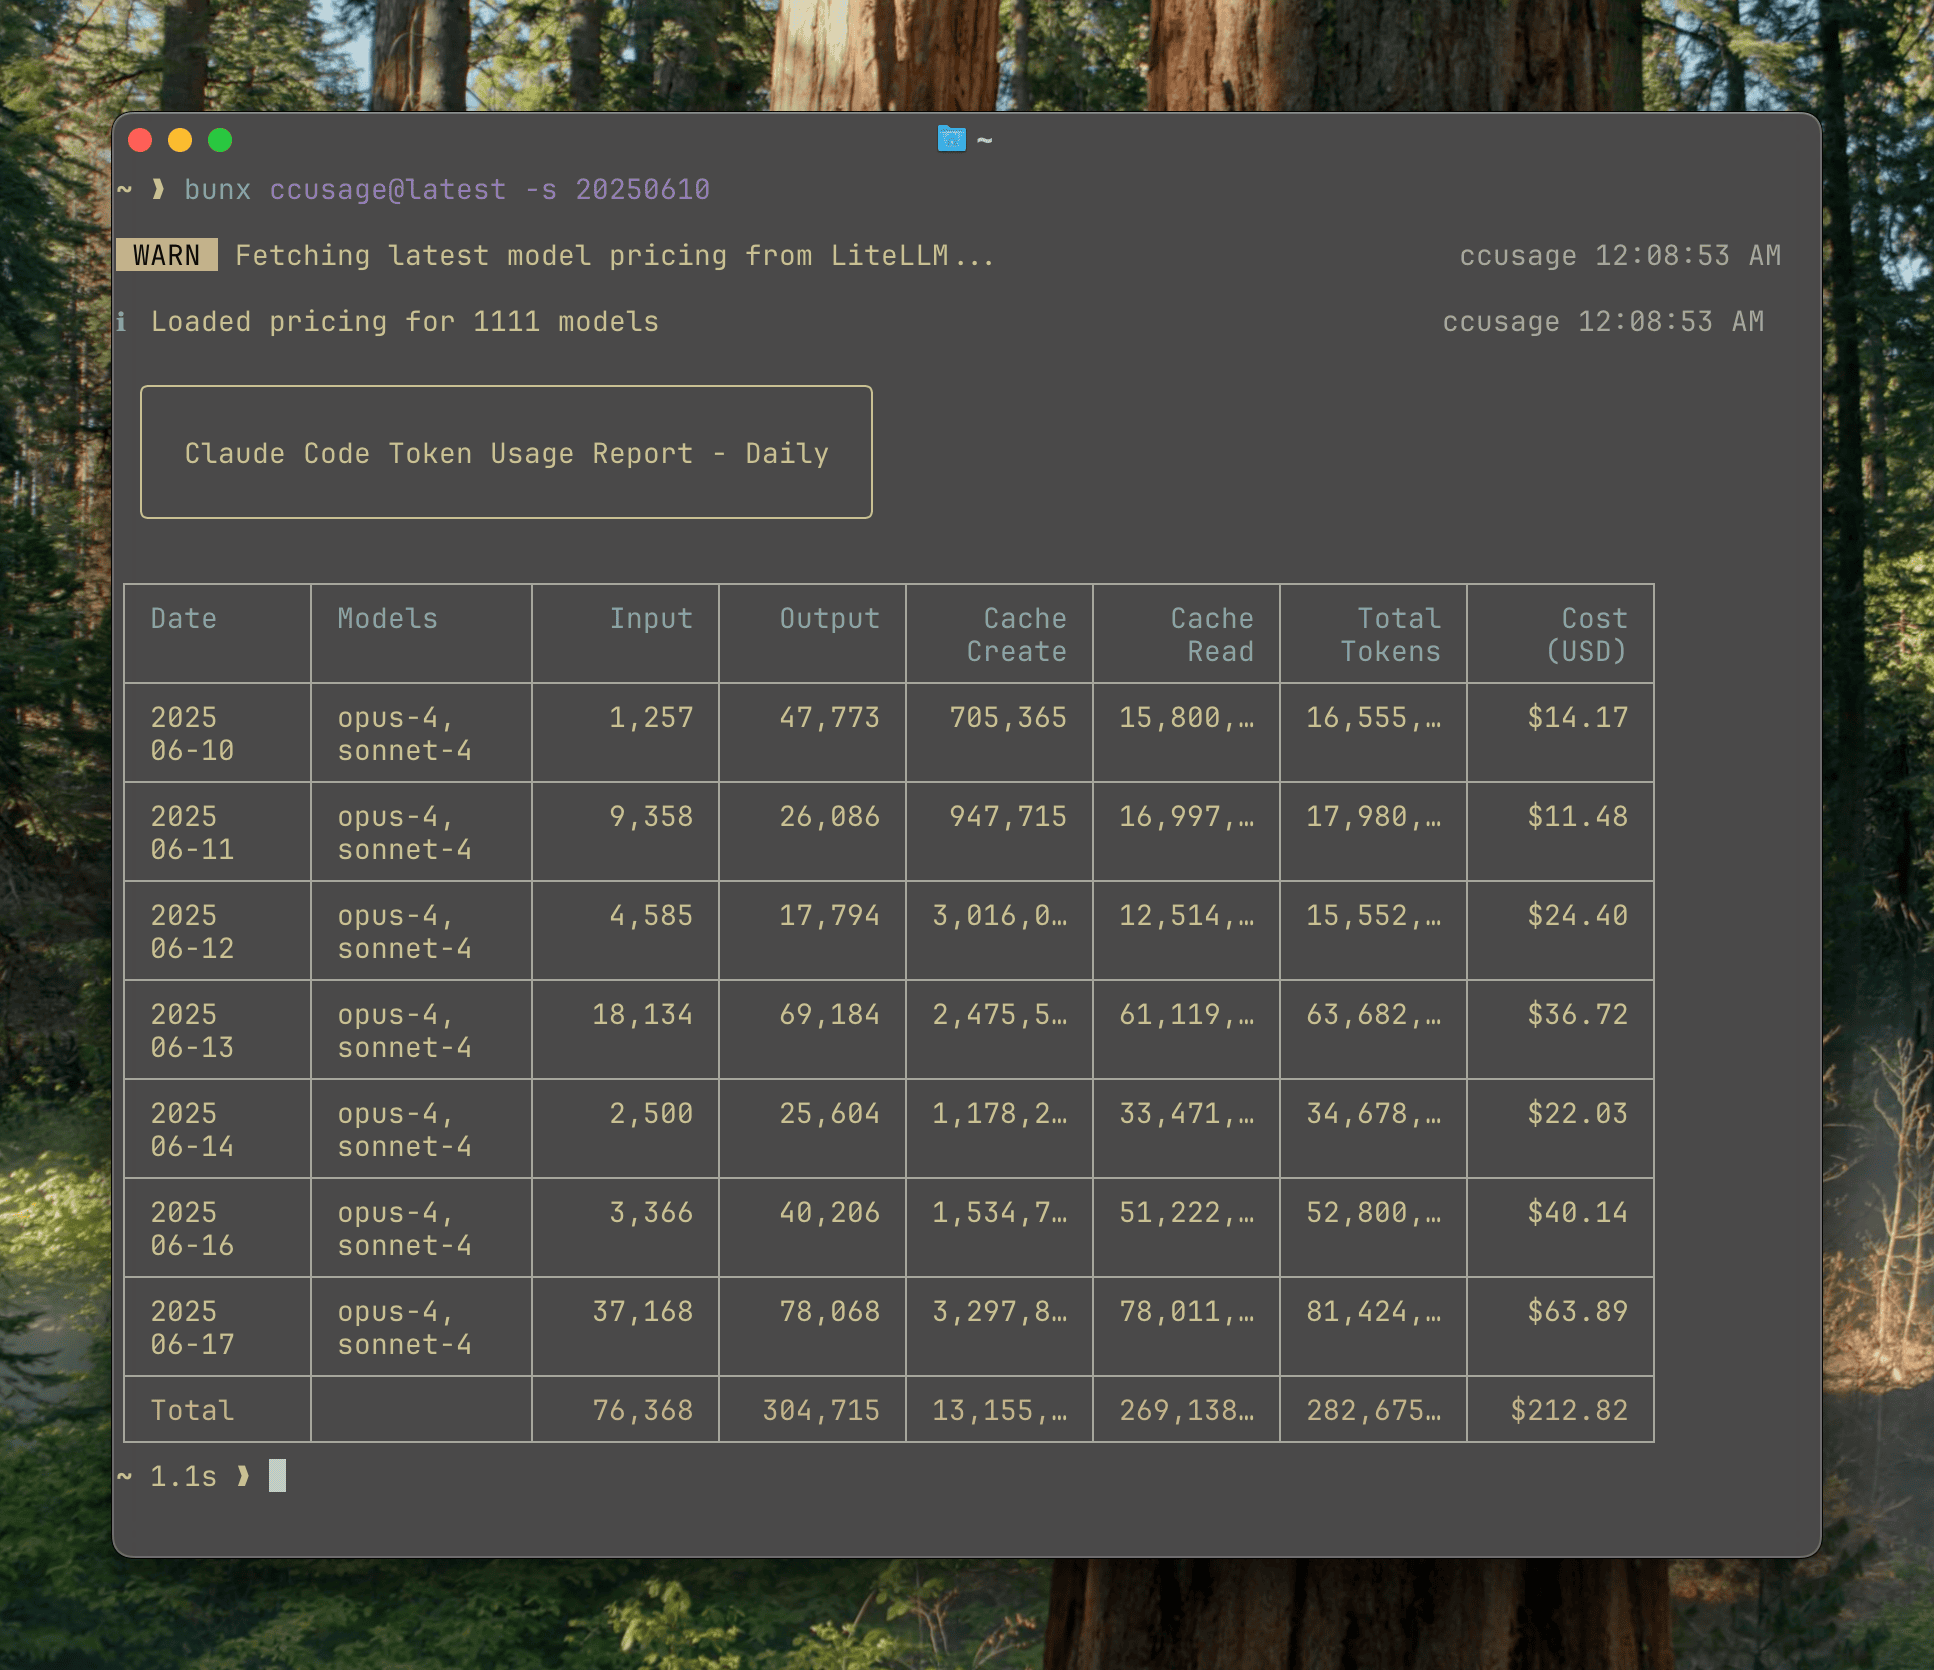
Example Output
Understanding the Columns
Basic Columns
- Date: Calendar date in YYYY-MM-DD format
- Models: Claude models used that day (shown as bulleted list)
- Input: Total input tokens sent to Claude
- Output: Total output tokens received from Claude
- Cost (USD): Estimated cost for that day
Cache Columns
- Cache Create: Tokens used to create cache entries
- Cache Read: Tokens read from cache (typically cheaper)
Responsive Display
ccusage automatically adapts to your terminal width:
- Wide terminals (≥100 chars): Shows all columns
- Narrow terminals (<100 chars): Compact mode with essential columns only
Command Options
Date Filtering
Filter reports by date range:
bash
# Show usage from December 2024
ccusage daily --since 20241201 --until 20241231

# Show last week
ccusage daily --since 20241215 --until 20241222

# Show usage since a specific date
ccusage daily --since 20241201
Sort Order
Control the order of dates:
bash
# Newest dates first (default)
ccusage daily --order desc

# Oldest dates first
ccusage daily --order asc
Cost Calculation Modes
Control how costs are calculated:
bash
# Use pre-calculated costs when available (default)
ccusage daily --mode auto

# Always calculate costs from tokens
ccusage daily --mode calculate

# Only show pre-calculated costs
ccusage daily --mode display
Model Breakdown
See per-model cost breakdown:
bash
ccusage daily --breakdownThis shows costs split by individual models:
┌──────────────┬──────────────────┬────────┬─────────┬────────────┐
│ Date         │ Models           │ Input  │ Output  │ Cost (USD) │
├──────────────┼──────────────────┼────────┼─────────┼────────────┤
│ 2025-06-21   │ opus-4, sonnet-4 │    277 │  31,456 │     $17.58 │
├──────────────┼──────────────────┼────────┼─────────┼────────────┤
│   └─ opus-4  │                  │    100 │  15,000 │     $10.25 │
├──────────────┼──────────────────┼────────┼─────────┼────────────┤
│   └─ sonnet-4│                  │    177 │  16,456 │      $7.33 │
└──────────────┴──────────────────┴────────┴─────────┴────────────┘
JSON Output
Export data as JSON for further analysis:
bash
ccusage daily --jsonjson
{
	"type": "daily",
	"data": [
		{
			"date": "2025-06-21",
			"models": ["claude-opus-4-20250514", "claude-sonnet-4-20250514"],
			"inputTokens": 277,
			"outputTokens": 31456,
			"cacheCreationTokens": 512,
			"cacheReadTokens": 1024,
			"totalTokens": 33269,
			"costUSD": 17.58
		}
	],
	"summary": {
		"totalInputTokens": 277,
		"totalOutputTokens": 31456,
		"totalCacheCreationTokens": 512,
		"totalCacheReadTokens": 1024,
		"totalTokens": 33269,
		"totalCostUSD": 17.58
	}
}
Offline Mode
Use cached pricing data without network access:
bash
ccusage daily --offline
# or short form:
ccusage daily -O
Common Use Cases
Track Monthly Spending
bash
# See December 2024 usage
ccusage daily --since 20241201 --until 20241231
Find Expensive Days
bash
# Sort by cost (highest first)
ccusage daily --order desc
Export for Spreadsheet Analysis
bash
ccusage daily --json > december-usage.jsonCompare Model Usage
bash
# See which models you use most
ccusage daily --breakdown
Check Recent Activity
bash
# Last 7 days
ccusage daily --since $(date -d '7 days ago' +%Y%m%d)
Tips
- Compact Mode: If your terminal is narrow, expand it to see all columns
- Date Format: Use YYYYMMDD format for date filters (e.g., 20241225)
- Regular Monitoring: Run daily reports regularly to track usage patterns
- JSON Export: Use
--jsonfor creating charts or additional analysis
Related Commands
- Monthly Reports - Aggregate by month
- Session Reports - Per-conversation analysis
- Blocks Reports - 5-hour billing windows
- Live Monitoring - Real-time tracking